Introduction
EV Adoption Rate in the USA 2025 industry stands at a major turning point in 2025. Over the past decade, the EV sector has grown from niche curiosity to mainstream reality, transforming how Americans think about transportation. With federal tax incentives, increasing environmental awareness, and rapidly expanding charging networks, the United States is now witnessing a remarkable surge in EV adoption.
Understanding EV Adoption Rate
The EV adoption rate measures how many new car buyers are choosing electric vehicles instead of traditional gasoline models. It is often expressed as:
EV Adoption Rate = (EV Sales ÷ Total Vehicle Sales) × 100
It can also be measured as the share of EVs in total vehicles on the road.
Tracking this rate helps policymakers and investors understand how quickly the nation is transitioning toward sustainable mobility.
Current EV Adoption Trends in the USA (2025 Overview)
As of mid-2025, the U.S. EV market has achieved remarkable milestones:
| Metric | Data (2025) | Source |
|---|---|---|
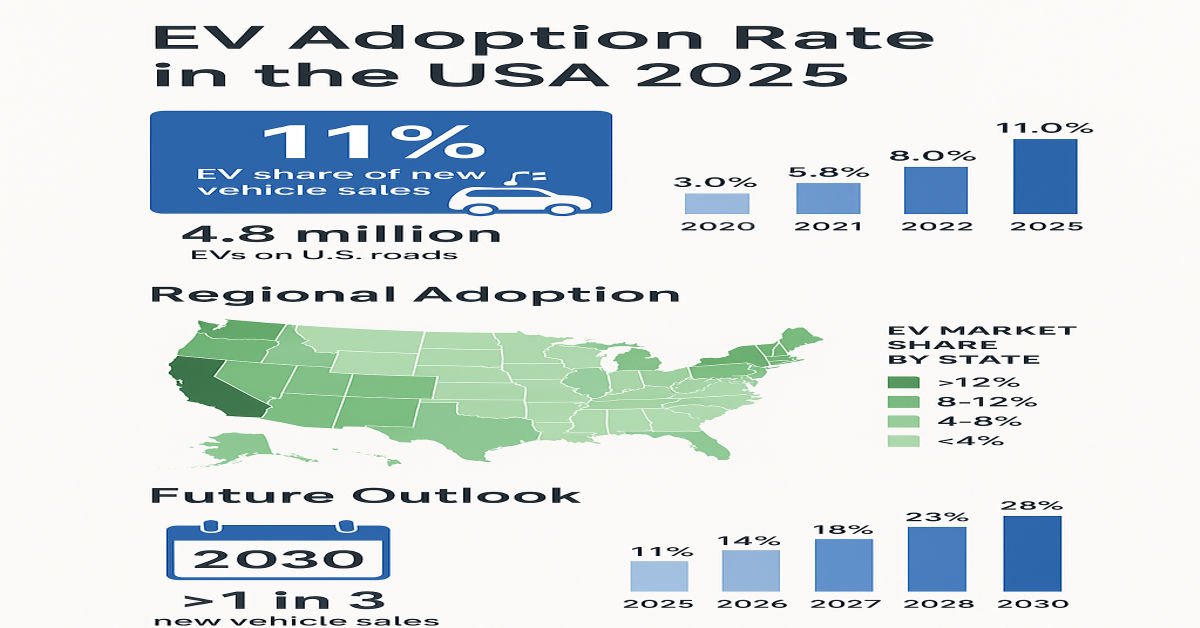
| EV Share of New Vehicle Sales | 10.2% – 11.5% | IEA & JD Power Reports |
| Total EVs on U.S. Roads | 4.8 million+ | U.S. DOE Alternative Fuels Data Center |
| EV Sales in 2024 | 1.6 million units | IEA Global EV Outlook 2025 |
| Fast Chargers Nationwide | 55,000+ DC Fast Chargers | U.S. Department of Energy |
| Average EV Price (after incentives) | $42,000 | Kelley Blue Book |
These numbers illustrate that EVs are no longer niche products — they are becoming a significant portion of new vehicle sales, with 2025 marking a key milestone for nationwide growth.
Regional Adoption: Which States Lead the EV Revolution?
EV adoption varies widely across the U.S. Some states have advanced policies and infrastructure that accelerate adoption, while others are still in early stages.
| Rank | State | EV Market Share (2025) | Key Driver |
|---|---|---|---|
| 1 | California | 25% | ZEV mandate, large incentives |
| 2 | Washington | 18% | Renewable energy policies |
| 3 | Oregon | 16% | Strong public charging networks |
| 4 | New York | 12% | State rebates and urban EV fleets |
| 5 | Colorado | 11% | Local tax credits and EV-friendly laws |
| 6 | Texas | 9% | Corporate fleet electrification |
| 7 | Florida | 8% | Rapid infrastructure development |
| 8 | Illinois | 7% | EV manufacturing hubs |
| 9 | Massachusetts | 6% | Aggressive clean-energy goals |
| 10 | Arizona | 6% | Solar-powered charging stations |
California remains the clear leader, responsible for nearly one-third of total U.S. EV sales in 2025. The state’s Zero Emission Vehicle (ZEV) mandate and charging infrastructure investments have made it a model for the nation.
The Federal Push: Policies Driving Adoption
Federal initiatives play a central role in EV adoption. The Inflation Reduction Act (IRA) continues to provide tax credits of up to $7,500 for eligible EVs in 2025. Additionally, the Bipartisan Infrastructure Law allocated over $7.5 billion for nationwide EV charging networks.
Key Federal Support Measures:
-
Clean Vehicle Tax Credit (2025): $3,750–$7,500 for qualifying new EVs.
-
Used EV Credit: Up to $4,000 for pre-owned EVs under $25,000.
-
Charging Infrastructure Credit: 30% rebate on home or business charger installations.
-
Federal Fleet Electrification: All government vehicle fleets transitioning to electric by 2035.
These policies are not only increasing EV sales but also boosting domestic EV manufacturing and creating green jobs.
Consumer Factors Influencing EV Adoption
Despite incentives, several behavioral and economic factors influence how fast Americans adopt EVs.
A. Economic Considerations
-
Fuel savings: EV drivers save about $1,000–$1,200 per year on fuel costs.
-
Maintenance: EVs have 30–40% lower maintenance costs compared to gasoline vehicles.
-
Battery warranty: Most EV batteries now come with 8–10-year warranties.
B. Environmental Awareness
With increasing awareness of climate change, many consumers choose EVs for their zero tailpipe emissions. Each EV can save up to 4.6 metric tons of CO₂ annually compared to gasoline cars.
C. Technological Appeal
EVs attract consumers with:
-
Instant torque and smooth acceleration
-
Advanced infotainment systems
-
Over-the-air software updates
-
Autonomous driving features in select models
D. Charging Convenience
Access to home charging has become easier. Around 80% of EV owners charge at home, while urban dwellers increasingly rely on public networks.
Automaker Commitments in 2025
The EV transition is being accelerated by automakers’ commitments to electrification.
| Automaker | EV Goal (Target Year) | Popular 2025 EV Models |
|---|---|---|
| Tesla | 100% electric lineup | Model Y, Cybertruck, Model 3 Highland |
| Ford | 50% EV sales by 2030 | Mustang Mach-E, F-150 Lightning |
| GM | 100% zero-emission by 2035 | Chevy Equinox EV, Silverado EV |
| Hyundai | 7 new EVs by 2028 | Ioniq 5, Ioniq 6 |
| Toyota | 1 million EVs/year by 2030 | bZ4X, upcoming solid-state models |
| Rivian | Expanding production | R1S, R1T |
| Volkswagen | 70 EV models by 2030 | ID.4, ID.7 |
These investments are driving market competition, innovation, and cost reductions, all of which accelerate the national EV adoption rate.
Charging Infrastructure: Backbone of EV Adoption
Without convenient and reliable charging, EV adoption cannot thrive. The U.S. now boasts one of the fastest-growing charging networks in the world.
| Charging Type | Charging Speed | No. of Stations (2025) | Coverage |
|---|---|---|---|
| Level 2 (AC) | 4–6 hours | 80,000+ | Nationwide urban/suburban |
| DC Fast Charging | 20–40 minutes | 55,000+ ports | Interstate corridors |
| Tesla Superchargers | 250kW average | 20,000+ ports | 100% nationwide |
| Workplace/Commercial | Varies | 10,000+ | Business hubs & malls |
The National Electric Vehicle Infrastructure (NEVI) Program ensures all major U.S. highways have public chargers every 50 miles — a crucial step for long-distance EV travel.
Barriers Slowing EV Adoption
While EV adoption is growing, several challenges remain in 2025:
A. Upfront Cost
Even with tax credits, some EVs remain pricier than comparable gasoline vehicles. However, battery prices are falling — expected to reach $80/kWh by 2026, down from $150/kWh in 2023.
B. Charging Accessibility
In rural areas and apartment complexes, charging infrastructure is still limited. Public-private partnerships are needed to close the gap.
C. Battery Recycling and Supply Chain
Sourcing lithium, nickel, and cobalt sustainably remains a major concern. Fortunately, U.S. companies like Redwood Materials are expanding recycling operations to reclaim used battery materials.
D. Consumer Awareness
A portion of the U.S. population remains uncertain about EV technology, range, and maintenance, slowing adoption among late adopters.
Forecast: EV Market Growth Beyond 2025
Experts predict strong continued growth over the next five years.
| Year | EV Market Share (Forecast) | Total EVs on Road | Source |
|---|---|---|---|
| 2025 | 10–12% | ~5 million | IEA Global EV Outlook 2025 |
| 2026 | 14% | 6.5 million | BloombergNEF |
| 2027 | 18% | 8 million | Statista |
| 2030 | 28–30% | 14 million+ | U.S. DOE Forecast |
| 2035 | 50%+ | 25 million+ | EPA Clean Vehicle Goals |
By 2030, EVs are expected to account for one in three new cars sold in the U.S., reflecting both consumer confidence and policy support.
Economic and Environmental Impact
Economic Benefits
-
Over 250,000 jobs created in EV manufacturing, batteries, and infrastructure sectors.
-
Lower consumer spending on fossil fuels — estimated to save $200 billion by 2035.
-
Increased domestic manufacturing of batteries and semiconductors.
Environmental Impact
-
Reduced greenhouse gas emissions by up to 500 million metric tons annually by 2030.
-
Decreased dependence on imported oil, enhancing national energy security.
-
Improved urban air quality and public health outcomes.
Consumer Tips: How to Join the EV Revolution
If you’re considering buying an EV in 2025, here are some expert tips:
-
Check Federal and State Incentives — Use the IRS Clean Vehicle Lookup tool to verify eligibility.
-
Evaluate Charging Access — Install a home charger or ensure public chargers are accessible nearby.
-
Compare Total Cost of Ownership (TCO) — Include fuel, maintenance, and insurance savings.
-
Consider Range Needs — Most EVs now exceed 250–300 miles per charge.
-
Explore Used EVs — The secondary EV market is expanding rapidly with attractive pricing.
-
Look for Battery Warranties — Choose models offering 8–10-year warranties for peace of mind.
Expert Insights on U.S. EV Adoption
“EV adoption in 2025 reflects both consumer readiness and industrial transformation. We’re shifting from early adopters to the early majority.”
— John Bozzella, CEO, Alliance for Automotive Innovation
“Infrastructure is the backbone of this movement. The NEVI network is making cross-country electric travel a normal experience.”
— Jennifer Granholm, U.S. Secretary of Energy
“By 2030, EVs will dominate urban sales, with mass adoption following swiftly once affordability aligns.”
— BloombergNEF 2025 Outlook
These expert insights highlight the strong momentum behind EV adoption despite short-term market challenges.
Conclusion: 2025 — The Year of Mainstream EV Adoption
The year 2025 represents a critical inflection point in America’s EV transition. With over 10% of new car buyers choosing electric, the U.S. is firmly on the road toward sustainable transportation.
Yet, this journey is far from over. To reach full adoption, challenges like affordability, charging infrastructure, and consumer education must be addressed collectively.